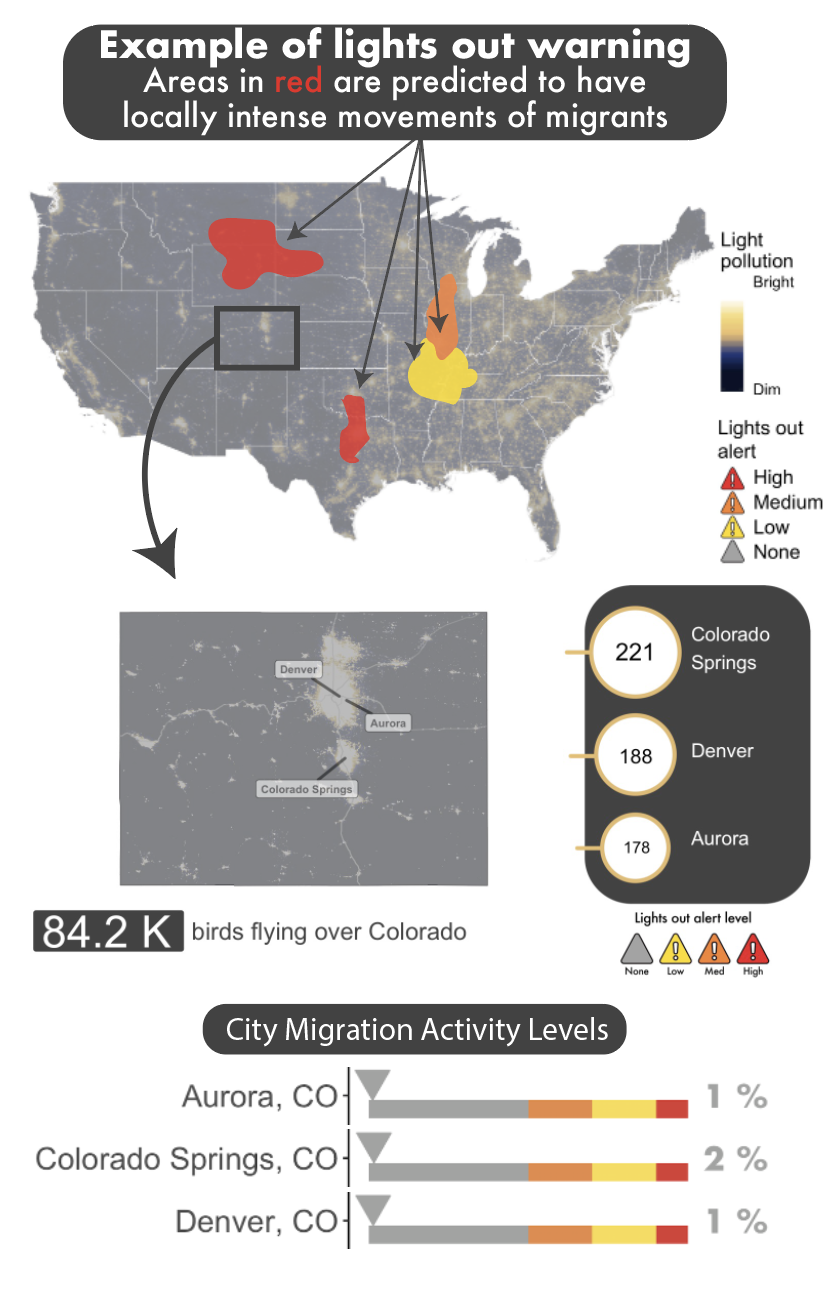
During spring and fall, migration forecasts and lights out alerts can on the AeroEco website. Because our models are trained specifically for migration seasons, forecasts are disabled outside of these periods. Spring forecasts return in March and fall forecasts in August.
Light pollution represents a relatively new stimulus on earth’s surface. For organisms that have evolved to migrate under the cover of darkness, the effects of light pollution can be deadly. For birds, lights at night can attract, disorient, and at times, result in deadly collisions with buildings, communication towers, and other aerial structures. The vast majority (80%) of birds in North America migrate at night, making it imperative to limit artificial light pollution for the conservation of migratory birds.
The negative effects of artificial light on birds have been known for decades. Lighthouses, illuminated ships, oil platforms, and other prominently lit structures yield some of the most gripping and grave examples of these impacts. The iconic Washington Monument, defining the nighttime skyline of D.C., claimed 576 birds on September 12, 1937, including 17 warbler species (Overing 1938). This staggering event occurred in just an hour and half, killing an average of 6.4 birds per minute. Jump forward 80 years, nearly 400 birds were killed in 2017 when they collided with a single brightly lit high-rise in Galveston Texas. It’s estimated that as many as a billion birds will die each year due to collisions with buildings —with artificial light acting as an amplifying agent. Yet light attraction isn’t just a problem for birds; mammals, reptiles, amphibians, fishes, and invertebrates face some of the same pressures. While our lights out alerts focus on birds, it’s worth exploring Rich and Longcore (2006) for a more in-depth review of the ecological consequences of artificial night lighting, including birds and much more. For birds, however, we’re hoping to change the status quo of bird collision warnings.
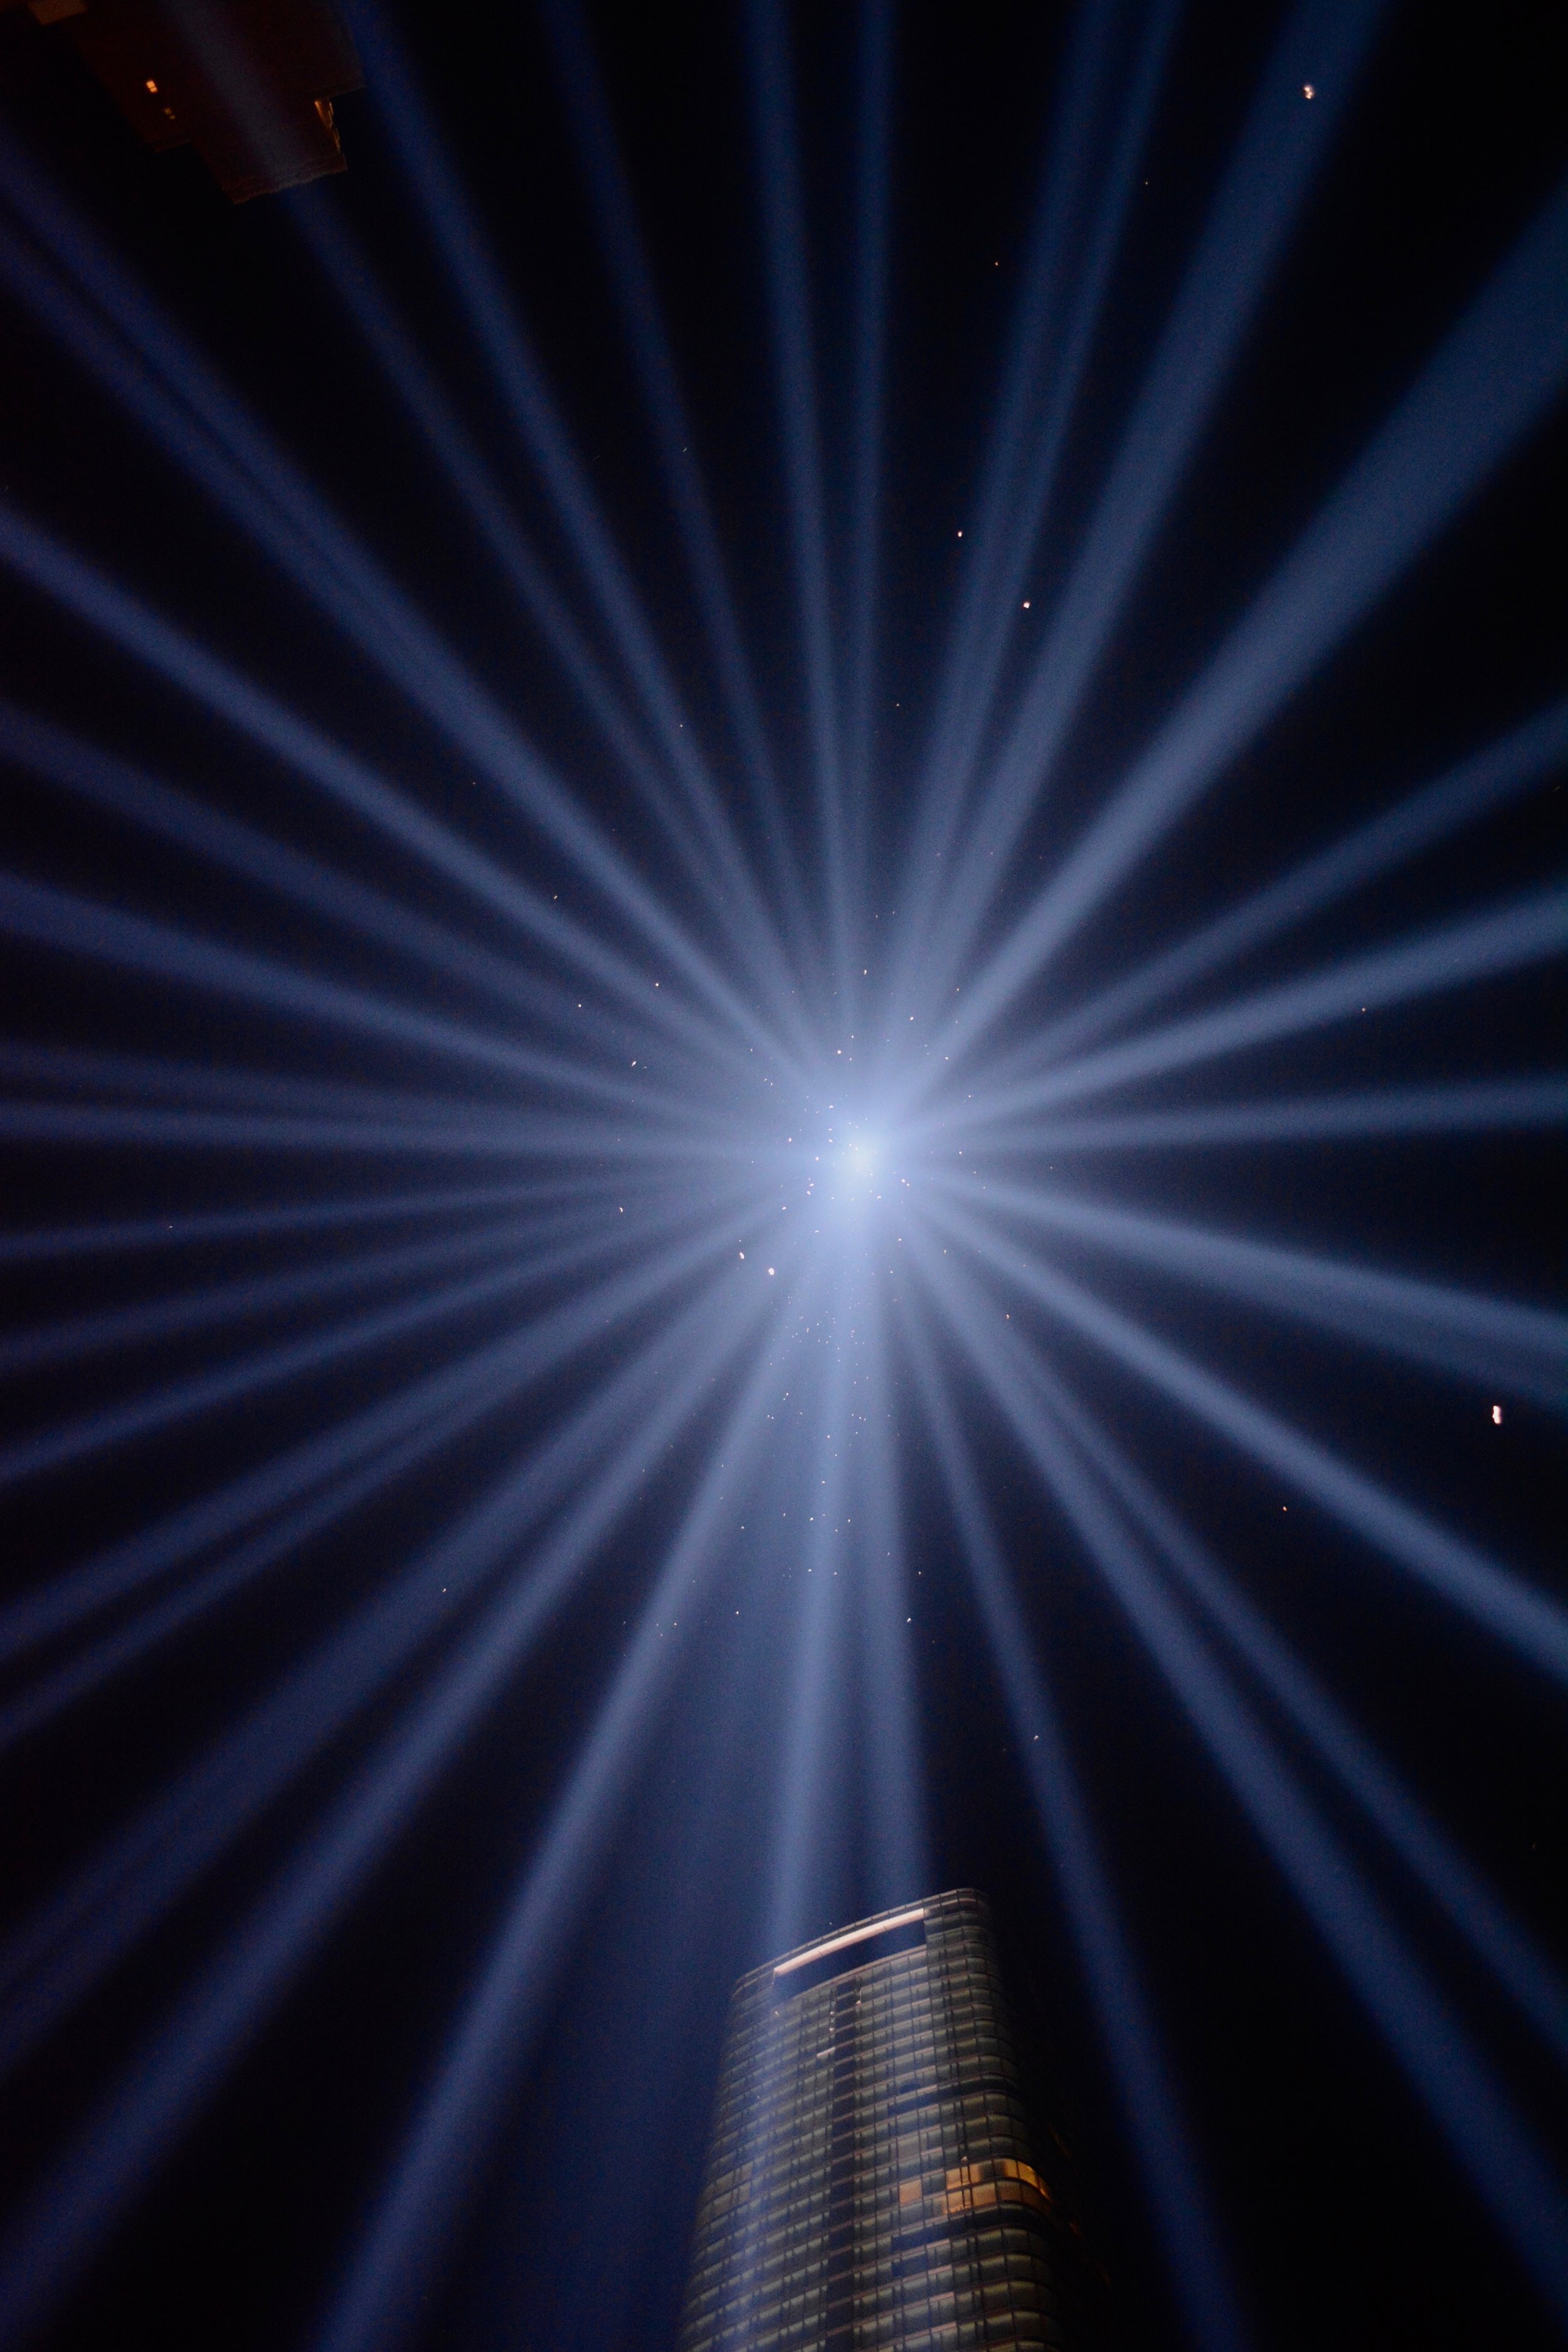
While fatal collisions often grab our attention, birds don’t need to necessarily collide with structures to be impacted by lights. Our investigations at the NYC September 11th Tribute in Light revealed this very fact, quantifying the scope and magnitude of attraction at this highly concentrated light source. Using radar, we estimated that as many as 1.1 million birds were impacted by these lights over a 7 year period (7 nights). See Van Doren and Horton et al. 2017 for additional details on this study, including how lights affect the vocal activity of birds. But more importantly, when the lights were turned off, we saw (via radar) dramatic decreases in activity around the lights, taking no more than 20 minutes for the birds to dissipate. Through partnerships with NYC Audubon, Cornell Lab of Ornithology, and the National September 11 Memorial & Museum’s, periodically turning off this important light source —for birds— is a reality.
Turing off lights at night is the obvious solution — yet determining where and when to turn off lights at a large scale has remained a challenge. It’s unrealistic to expect citizens or businesses to go dark for the entirety of spring and fall, especially when migrants don’t migrant every night. Emphasizing action on the most intense nights of migration has the benefit of mitigating these negative impacts on birds, while minimizing changes to human behavior. We use migration forecasts (see Van Doren and Horton 2018 for details) to issue alerts to turn off lights where and when migration is predicted to be especially high across the USA. Our alerts target the most intense nights of migration from historical measures.
Doppler radar measures of bird migration from the Pittsburgh area (KPBZ radar). Note that 50% of migrants pass through the airspace in just 7 nights of the season.


